We do retirement income planning and nothing else.

We do retirement income planning and nothing else.
Chancery Lane was created by baby boomers, for baby boomers.
After forty years receiving a monthly paycheque, what you really need in retirement is a monthly paycheque.
Do-it-yourself income planning can be like DIY dentistry, not really for the enthusiastic amateur.
Our systems and services are designed for portfolios of £250k+.
We believe in simple, low fees. "Price is what you pay, value is what you get.” - Warren Buffet.
We specialise in long term income as we assume our clients want a long-term retirement.
If at any time you needed a qualified opinion on your financial planning, this is probably it.
We remove the fuss from pension income. We take boringly reliable as a compliment.
Investors who bought Lowland trust in 2009 received an income yield of 15% in 2020.


Read more, or go straight to try
our RPI-analysis tools
Hello, World!
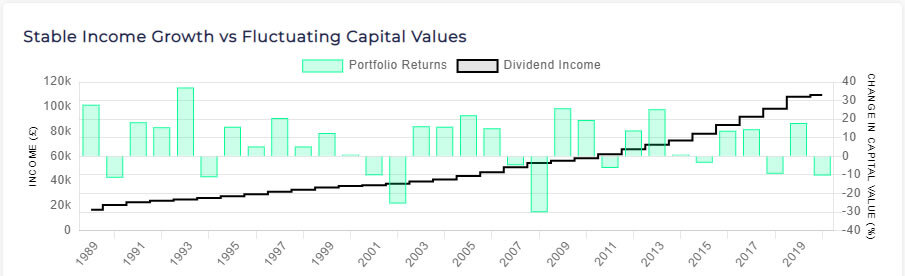
This is the single most important chart for any income investor, it is the Key Chart for the selected portfolio.
What does this show? It shows the capital value change in each calendar year for 30 years (blue bars), overlaid with the actual income payments paid out over that period (red line).
Why is this important? The Chancery Lane algorithm creates portfolios where there is no or weak correlation between income and capital. This allows retirees to receive predictable income irrespective of what the FTSE is doing.
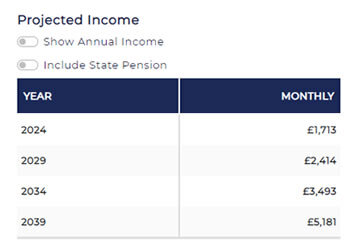
The projected income table allows you to take a view of what income might be received each year if the portfolio’s historical income growth rate is applied to the actual last year income. Past returns are no indication of future returns.
Figures are shown as annual or monthly figures.
An estimate of state pension can be included
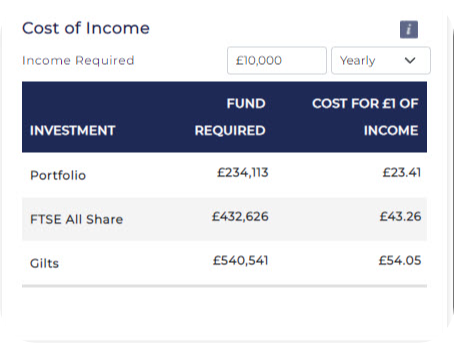
The Cost of Income table allows you to enter the income you require and then calculates the funds required to achieve that income using your selected Portfolio, the FTSE All Share and Gilts. You can enter the income target as an annual or monthly figure. The second columns shows the same data as the cost of £1 in income.
If you wish to explore how these calculations are made, please contact us.

Bucket List Top 50
How many have you ticked off?

Wellbeing
Dealing with a new life without a daily schedule.

My Generation
What it means to be a boomer — how many of these experiences defined your life?
In this blog:
1. What happened in the markets to cause the sell off.
2. What the man from Investors Chronicle did to an annualised 15% return.
3. Where the US is hiding $7.4 trillion.
4. Robbing trains – yep, it’s still the Wild West in the US.
In this blog:
1. Charges? A word on St James Place’s recent change
2. The Trump Effect on the markets
3. The average age of a client is 62
4. I’ve Got Random Pension Pots Everywhere – Now What?
5. The Gen X Takeaway
6. Can I Retire Without Selling a Kidney?
In this blog:
Nvidia - up when it’s up
This was when you were a teenager
When irrational kicks in.
What financial independence is really like: how others have retired
Meet Steve, Betsy, Tilly, Lawrence, Martin, Jack, Derek, Bruce, Jessie, Stephen and Jim.
Lives well lived.
In this blog:
There’s just one subject: a meeting with a prospective client brought a realisation to us when he said ‘But I had no idea you did all that’. We take what we do for granted, and for that I’m sorry, so let me explain…
In this blog:
The make-up of investment growth
Gearing investments – not what you expect
Tariffs – what Trump has done to smoothies, mangoes and the Chevy Silverado
The difference between Bill Gates and Warren Buffett, in Warren’s words
When the rich get richer