When was the last time?

by Doug Brodie
In this blog:
/1. Lucky vs repeatable
/2. Trouble at the EV offices
/3. Ros Altmann – Baroness – and the trouble with trusts
/4. I had an interesting conversation with my three-year-old granddaughter about a bear that is really called Winnie the Pooh (you can fill in the gaps)
/5. Standard deviation and Sortino Ratios in portfolio comparisons
/1. Lucky vs repeatable
We’ve written before about Morgan Housel, an ‘investment philosopher’, writer and guru who works at collabfund.com, a business with a great mission statement of:

Our mission is to identify and support companies that live at the intersection of for-profit and for-good.
Morgan’s recent article is titled ‘Lucky v repeatable’, and in it he discusses the difference between the luck of winning the lottery and Jeff Bezos’ luck with Amazon. He looks at ‘luck’ from the perspective of what is repeatable and what is not. Could Bezos repeat Amazon? Probably not. Like Zoom in 2020, timing and external factors can often be dominant.
Our own personal example of the impact of timing: in 1997 I sat down with Ian Manning and discussed how an independent adviser could get valuations for one client from (say) 4-5 different investment firms holding the client money. Our solution was a project using ‘fax broadcasting’ as the internet was still embryonic. Timing of internet usage stopped us in our tracks.
Morgan quotes Jason Zweig of the Wall Street Journal when investors get it wrong in trying to learn a non-repeatable lesson, when a very repeatable lesson is actually needed:
[After the dot-com crash], the lesson people learned from that was not, “I should never speculate on overvalued financial assets.” The lesson they learned was, “I should never speculate on internet stocks.” And so the same people who lost 90% or more of their money day-trading internet stocks ended up flipping homes in the mid 2000s, and getting wiped out doing that. It’s dangerous to learn narrow lessons.
Your objective in income investing to sustain your financial independence is to have the most repeatable outcome available, repeatable for your lifetime.
/2. Trouble at the EV offices.
The Economist has put together a surprising summary of the EV electric vehicle industry. In late 2021, just thirty-two months ago, the combined market value of five prominent Tesla clones was $400 billion, and that has now fallen by 83% to ‘just’ $69 billion. Where that gets particularly dangerous is where professional investors geared their investments into these firms, secured against the stock being bought, or where those car companies had/have bank borrowings subject to the overall value of a firm.
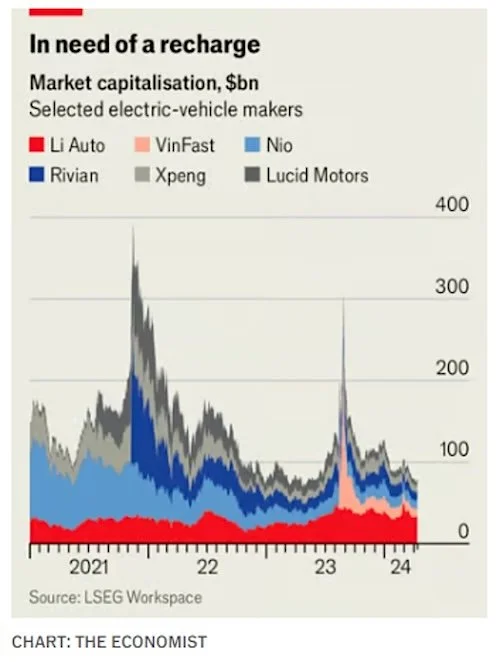
Pumping up shareholdings into a $400 billion balloon that then collapses inevitably forces some punting firms (you might know them as hedge funds) to sell back to cash to repay their loans, and even to sell other geared stocks to pay down the loans. This is why the collapse here could be a trigger.
Lordstown took over a GM assembly plant to build electric pickups in 2018 – it went bust last year. As a side issue, its directors sold $8m of stock in the month before the firm fell off a cliff.

Fisker intended to launch into the luxury market, however after eight years from start it has stopped production, its share price has crashed and it may soon be delisted.

VinFast is a Vietnamese firm that was started in 2017 went public last year, briefly hit $190 billion last August and is now back down to earth at $9 billion, a mere 95% fall. Rivian is only valued at <7% of its peak. The Economist reports the suggestion that 500,000 cars per year need to be sold for anyone to make a profit – beware China then, where the phone maker Xiaomi in March launched a saloon car with a base price of $30,000 and had 90,000 orders within 24 hours (it is reported).
/3. Ros Altmann – Baroness – and the trouble with trusts.
Ros is a good North Londoner whom I ended up sitting beside on a bus heading out of Monaco (as you do) – she has been in the press recently fighting to get cost disclosure rules for investment trusts changed. This doesn’t affect you – everything we do and show and calculate is based on net returns, in much the same way that if you own a share in HSBC your returns are after all their costs.
Brussels, dear Brussels, back in the years of our EU membership, introduced cost discovery rules for investment trusts that required them to include the costs from underlying companies so suggesting the firms were charging an exceedingly expensive fee – they aren’t. That’s like valuing Easyjet on all its operating costs and comparing those costs to a passive index tracker. The reason the rules still exist is because when we came out of Europe the government agreed to keep part of Brussels rules about investment firms so that the investment banks in London could stay here and not have to move to Frankfurt or Paris. If you have a fund of funds, a discretionary fund or a pension scheme you have to declare those (irrelevant and misleading) charges as the actual costs, which means trustees have no choice but to reject the trusts and stick to unit trusts and ETFs.
We don’t have to bother, and we don’t. We explain to you the charges face to face and carry on.
/4. I had an interesting conversation with my three-year-old granddaughter about a bear that is really called Winnie the Pooh (you can fill in the gaps).
According to our chums at Visualcapitalist.com, as media franchises Mickey Mouse is worth $74 billion, Winnie the Pooh comes in at $76 billion, however, they are both trumped by Pokémon at a massive $147 billion. Of that last figure, Pokémon trading card franchise is valued at $12 billion which is about the same value as BT. Hmmm.

/5. Standard deviation and Sortino Ratios in portfolio comparisons
Kseniia Gostieva
To select the best portfolio for investment, there is a need to use a common indicator by which the financial performance of portfolios can be compared and this would help make a choice towards the best option, as well as identify a weak portfolio that has given the worst results in past periods. Research on options when evaluating portfolios would provide some answers.
First, as an example, we took 3 fictitious portfolios and put random numbers on them for the annual return over a period of 3 years with an initial investment of £100,000.
For the first two examples Ex.1 and Ex.2 - Annual return %, the same numbers were taken but put in a different order in different years, which gave the same result for Average Annual Growth Rate (AAGR) - 7.67%.
In example Ex.3, one of the numbers was replaced with a negative return with an average of Average Annual Growth Rate (AAGR) - 4.67%. This will make it possible to understand how negative Annual return affects the indicators that we evaluate. When analysing the portfolio, we used such assessment methods as: Standard deviation; Semi-Deviation; Downside Deviation and Sortino Ratio. (See picture 1)

Picture 1
Our analysis shows that using Standard deviation for comparing portfolios is not suitable since the result may be with the same numbers despite the fact that the compared portfolios have different both growth and decline.
This is due to the fact that Standard deviation shows the volatility of values both in growth and in decline. This fact makes the analysis unreliable and inappropriate if you want to choose a stronger portfolio. Since a rise in Value is good for an investor, a fall is bad. Therefore Standard deviation does not tell us which of the compared portfolios will be better.
In the examples Ex.1, Ex.2 and Ex.3 - Sample standard deviation is 10.69%. And the Population standard deviation is similarly the same for all 3 examples, 8.73%. That is, if there is a negative portfolio return, we will not see this in the Standard deviation indicator, accordingly we will also not be able to make an informed decision.
In this case, one could use Semi-Deviation and Downside Deviation since they look only at negative price fluctuations.
These indicators take indicators below average or the specified Target return as a starting point. However, this indicator also cannot be analysed separately, since with the same set of data but in a different order it can give the same values.
In the examples Ex.1 and Ex.2, Semi-Deviation is equal to 6.19%, despite the fact that the first portfolio Ex.1 ends the 3rd year with an increase in Annual return equal to 20% and portfolio Ex.2 showed a worse result than in the previous year and Annual return for the 3rd year it is equal to 2% against 20% of the previous year. This is especially important if money is withdrawn every year.
For to display volatility in asset prices, an indicator such as the Sortino Ratio index is more suitable. It takes the return of an asset or portfolio and subtracts the risk-free rate, and then divides this amount by the downside deviation of the asset. Sortino Ratio only takes into account returns that fall below a user-specified target or required rate of return.
The higher the Sortino Ratio, the better the return on investment. An SR index less than “0” will indicate that the return is less than the Risk Free Return, which threatens the investment. However, if the Average Return% is equal to the Risk Free Return percentage, the coefficient will show “0”. Moreover, in comparing estimated different portfolios where the average % return is the same equal to Risk Free Return, there may be a drop in return for individual years below “0”, which the Sortino Ratio index will not show. This complicates profitability analysis as it produces vague results.
In the example we tested, we can see whether the portfolio is unprofitable using indicators such as CAGR, AAGR and AGR. The lower the values for them, the worse the portfolio return. In the figure we see that portfolio Ex.3 is unprofitable. Portfolios Ex.1 and Ex.2 have the same values although they had different returns in the second and third years.

Picture 2
For a more detailed study, next time we took 18 fictitious portfolios with a random set of numbers. The period we analysed was 10 years. Moreover, some portfolios have the same Annual return numbers but are arranged in a different order. Which again gives the same indicators for Standard deviation and Sortino Ratio.

Picture 3
One example of why Standard deviation is not the best choice for investment analysis can be seen in the example of Ex.P and Ex.Q. (Picture 3). Where Ex.P's portfolio shows both ups and downs, but this income rises. And for comparison, the Ex.Q portfolio showed a negative result 3 times in terms of Annual return, while both portfolios have the same Standard deviation (s) of 9.68% and Standard deviation (ơ) of 9.18%. In this case, they can be compared by comparing them by Sortino Ratio, but what would be more revealing would be comparing them by CAGR and AAGR (Picture 4).

Picture 4