Stormy... but no, not Stormy Daniels, and not Stormzy

by Doug Brodie
In this blog
The storm elements in western France
The storm elements in the investment atmosphere
Data driven research.
/1. The storm elements in western France

This is why there are fierce and violent storms in south-west France: weather fronts of three different types converge from three different directions. Cold air is sucked down from the Pyrenees in the south, heavy wet clouds roll in from the Atlantic, and hot air drives from the east from the dry massif central. It gets bad when there’s a canicule (the quaint French term for a heat wave). The hot air mixed with the wet Atlantic clouds produces biblical downpours, and the cold front from the mountains seems to act like an accelerant.
In 2003 winds hit 150 kph and four people were killed, in 2009 a hurricane (120 kph+) came across the Atlantic and felled more than 1 million trees. This year, all the rain and bad weather in the UK over the past couple of weeks has created deep and powerful wave surges in the far Atlantic which then hit the brick wall which is the French west coast. There is nowhere else for the waves to go.
/2. The storm elements in the investment atmosphere.
Regular readers of this newsletter, and all our clients, know that we have been very wary about the disparity between valuations of the US and UK markets. This chart shows the difference between the two on an investment of £100.

There are two elements at play with these differing returns, one being the growth and popularity of the US market, and the other being the malaise and unpopularity of the UK. This is a picture of the past – what we are interested in is the future years as that is where the danger lurks. Yesterday’s potholes are not a risk to investors, they are past, it’s the ones in the road ahead that will cause us problems.
Reversion to mean is real, it’s the return to the long-term mean of a series of returns; a permanently rising market will drag up that mean, however in the longer term the mean will discard both the peaks and troughs of an investment. This is what the US market looks like over the last twenty years; this is a relevant timescale, it shows the growth from the bottom of the market following the dotcom crash, and you can see it took ten years for the market to double, from 2003 to 2013. It then took four years to double again, and after a further six years it has (almost) doubled again. This is how the US has ended up with two companies worth over $ 1 trillion (Alphabet and Amazon) and two over $2 trillion (Microsoft and Apple).

At some time the US market will revert to the mean growth. Michael Burry is the US hedge fund investor who ‘got it right’ calling the 2008 crash (he of The Big Short) – he has leveraged a $1.6 billion position betting that both the Nasdaq and the S&P are heading for a major fall. That doesn’t mean he’s got it right.
Getting back to the start of our email, Zhongzhi is a state-backed asset manager in China that has stopped payments to investors in its products, has a liquidity crisis (run out of cash) and is seeking a debt restructuring. It in turn owns Zhongrong Trust, which itself has been reneging on payments on dozens of investment products.
Next, China’s largest private developer, Country Garden, had trading in a core part of its debt suspended on Monday, it missed $22.5m of interest payments on August 6th, and is due to repay to investors a total of $1.25 billion in September.
And then … China’s provinces collectively have $13 trillion of borrowed money - that’s some debt pile. Of that sum, the IMF has identified $9.1 trillion that has been set up in ‘off balance’ sheet vehicles used to pay for China’s infrastructure that has been needed for the country’s development. (Off balance sheet just means ‘pretending the debt isn’t really ours’). The China government is working on a rescue plan – some cities are paying 7-10% interest on these debts. A core part of the proposal is to allow the debt to be sold on, largely to state-owned banks, at a lower interest rate.
President Xi will be in deep, deep trouble if this debt blows up – as it may – so needs all the support he can muster to ensure the debt can be passed from Peter to Paul, without repayment required. And will he also need Sam involved, Uncle Sam? As the de facto controller of the world’s debt markets, it would seem there’s a real reason for Xi to maintain cordial relations with the US (perhaps Taiwan is safer that we think).
US valuations, China debt defaults, is western rising interest rates the grenade that triggers the storm? It might be. What happens next?
As a reader or a client you will likely be near or over 50, which means you were a teenager when the 1987 crash happened and the US market did this:
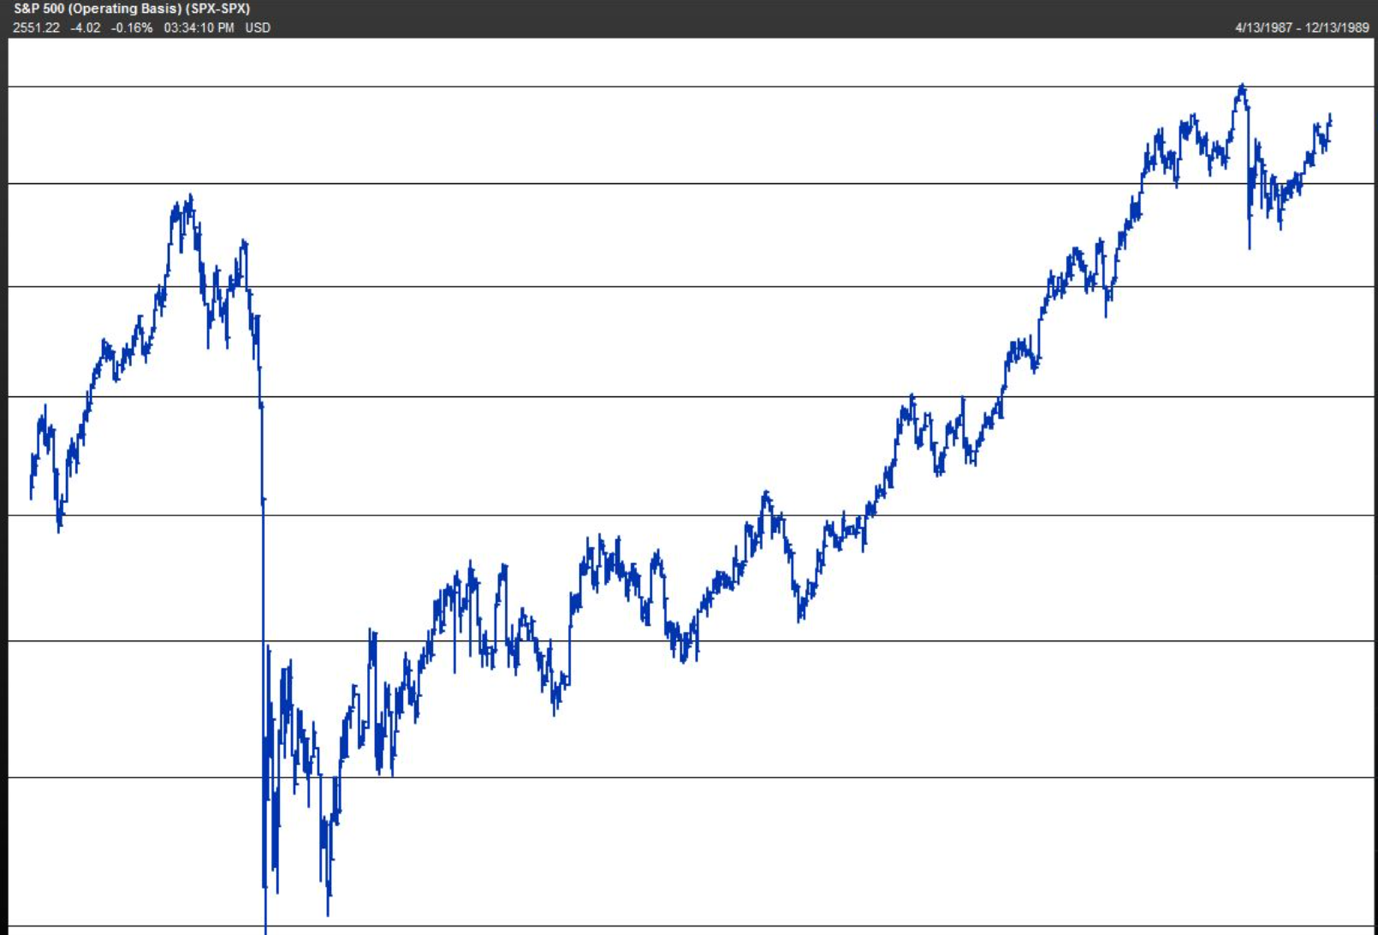
1987, dotcom, 2010 ‘flash crash’, credit crunch, covid – every time you have seen an almighty crash you have also seen the market turn right back round again, generally taking a year to recover in full.
/3. Data driven research
You are the biggest danger to your money in a crash – it is very, very difficult to ignore the emotional reactions you/we feel watching the market value of our assets fall. Despite the irrationality, ‘buy low, sell high’ is a very simple principle. For our clients, all our portfolios are designed with a specific view to income being likely to be maintained or increased when markets fall. Our research covers every major market fall excluding 1929 and the depression that followed: we use investment trusts because they have proven defensive in every scenario we have analysed, whereas open-ended funds, ETFs, unit trusts, pension funds, simply have not.
We cover stormy outlooks so that we can help our readers to the right frame of mind, so they don’t get caught unawares. As we have written frequently, the retail investor’s definition of risk is an asset doing something you were not expecting – on average you will see a major market correction of some type or other, every seven years or so, which means you’ll see several during your retirement: being aware helps the investor to be rational, not emotional in decision making.