Going cheap

by Doug Brodie
In this blog
Investment trusts have two problems for IFAs
The data behind an income portfolio
Inflation – a key differentiator made transparent with data.
/1. Investment trusts have two problems for IFAs
Investment trusts have two problems for IFAs: firstly they never paid commission and secondly most IFAs are not authorised to advise on them because they are market listed equities.
Since it started the advisory industry was dominated by the insurance companies you’ve heard of: Prudential at one time had 9,500 salespeople, Allied Dunbar had 4,500, Abbey Life apparently had 6,500. The insurers also ran the pension industry, and so invented funds. From that came unit trusts, the first being launched in 1931 by M&G. The first investment trust was Foreign & Colonial, launched back in 1868.
The problem with investment trusts was that they are, in fact, companies listed on the stock exchange. That means all the shares are already owned by investors, so for you to invest in a trust you have to buy shares from an existing investor, in precisely the same way as one might buy Vodafone or BT shares. As the shares are listed, an insurer like Pru can’t get investors’ money into its funds under management, unit trusts dealt with this.
A unit trust is owned outright and operated by an investment manager, initially by insurance companies. Instead of shares in a company (trust) the investor buys units in the fund, and it buys those units directly from the investment manager. In turn, the manager runs a ledger for the fund showing how many units there are and who owns how many. Simply put, a £100m unit trust may have 100 million units and each are therefore worth £1. If the investment in the unit trust grow buy 10%, then each unit price would grow to £1.10.
The problem for us has always been that manager-owned unit trusts (and pension funds and OEICS) sit in a grey and murky area of pricing and accounting that we won’t cover here, things the client never hears of but has been rampant behind the scenes, like ‘box pricing’: https://citywire.com/wealth-manager/news/fca-bans-fund-manager-box-profits/a1107581
Take 1,000 commission-only, self employed salespeople, add opaque investment pricing controlled by the investment manager, and the incentive to sell that manager’s funds was via commission. This meant that all those Pru, Dunbar, Abbey Life sales teams were only trained on their company’s products – because they were tied salespeople only allowed by the regulator to advise on their company’s products, they were never trained on investment trusts, ETFs, fixed interest assets, REITs or simple shares.
In today’s world a St James Place adviser is not permitted nor trained to advise on investment trusts as he/she is a self-employed tied agent, or working for a tied agency (SJP is the last of the big direct salesforces, being the re-establishment of the previous Allied Dunbar).

So when we’re asked ‘Why doesn’t everyone invest this way?’ – that’s the real reason why. It’s about what they get, not you.
/2. The data behind an income portfolio
In 2002 and again in 2007, unit trust investors watched their portfolio values fall off a cliff – it’s important to remember that the manager of, say, a ‘balanced managed’ fund is responsible for running the fund, not running your money, and is measured against his/her peers, not whether or not they are up or down. This leads to the perennially odd statement where an investment firm can say:

“Our fund is the best performing in its sector, with a fall of -10% versus the average of -15%”.
We look at the data, with numbers so we can tell precisely what income was, and calculate in numbers what growth rates a fund has produced. As you know, share prices are determined by daily trading on the stock markets, so that means we cannot create any accurate predictions about future values of shares. At best we anchor our strategies and thoughts to the long term average of market returns, and that means reversion happens to be real. The trouble with that for income investors is that investment cycles can be very long, and it can take years for reversion to mean to happen. We just need to look at the long decade just past of ultra low interest rates that are only now reverting to mean.
The Nikkei 225 went nowhere for 30 years, so for regular income, month in month out, simple stock investing does not work. You’d have to guess correctly what asset prices will do over the coming twelve months and get it right every time. (Even Mr Buffett doesn’t do that).

We use investment trusts because they hold accounting reserves that enable them to pay out income from their accounts. We whittle down the 410 trusts available to just 30 by looking at the dividend records – we look at the data in the track records.

This is a sample of trusts that we analyse. In our pool of 30 the following statistics are calculated for 2022, taking all those trusts together:
Total income they have received: £1.121 billion.
Total revenue reserve at start of the year: £898 million.
Total available for dividends in 2022 therefore: £2.019 billion.
2022 actual dividends paid: £885 million.
There’s quite a lot of reserves and income to support the dividends as you can see.
All those trusts have different objectives and different ways of doing things: Murray International has many overseas holdings – that brings a wider reach and breadth into view but also brings currency issues, so we have to be happy there are FX skillsets within the manager – in this case the manager firm is the giant Abrdn (what you knew previously as Standard Life).
With F&C, their overall goal is strong capital growth with consistent income; Merchants Trust is the other way round, it’s strong, high income front and foremost. City of London is different still as it hangs its hat on growing income, along with capital growth. So when we start to build a portfolio, it is always personalised:
What is the core level of yield needed, and what year is that income first to be paid?
How high a starting yield does the client need?
How cautious does the income need to be? (i.e. how much reserve cover?)
How strong annual growth in income does the client want?
What income growth relative to inflation does the client want?
It is the reserves that pay out the dividends, not the underlying shares, that’s why a trust like F&C has never skipped its annual dividend since the first in 1869. Sure, it’s not guaranteed, but we prefer to follow probability rather than possibility.
1987, dotcom, 2010 ‘flash crash’, credit crunch, covid – every time you have seen an almighty crash you have also seen the market turn right back round again, generally taking a year to recover in full.
/3. Inflation – a key differentiator made transparent with data
Income dealing with inflation is key to us. Costs and charges of investments are also key, which is why we use Vanguard and iShares funds and ETFs where relevant. We are independent, we are agnostic about investments, we simply follow the data as we don’t believe in crystal balls or macroeconomic short term forecasting (that’s a mug’s game).
We will publish our income vs inflation report some time in September, however here’s a snippet:
we compare income from a zero cost FTSE 100 index to that of any of our key trusts.
we take any investment term up to 30 years back (as that’s how long you’re likely to be retired, give or take).
we then take the income in the first year and increase that sum by RPI every year after up to the start of this year.
we then take the actual dividends that were paid each year for that trust, or portfolio of trusts.
we then plot each of the two scenarios on the one chart.
This is how the FTSE100 income fared against RPI over 30 years:

Income from the FTSE was lower than RPI in 23 out of 30 years. That is not the way you want to have your retirement income behave, no matter how cheap the charges.
This is how JP Morgan Claverhouse fared against RPI over 30 years:
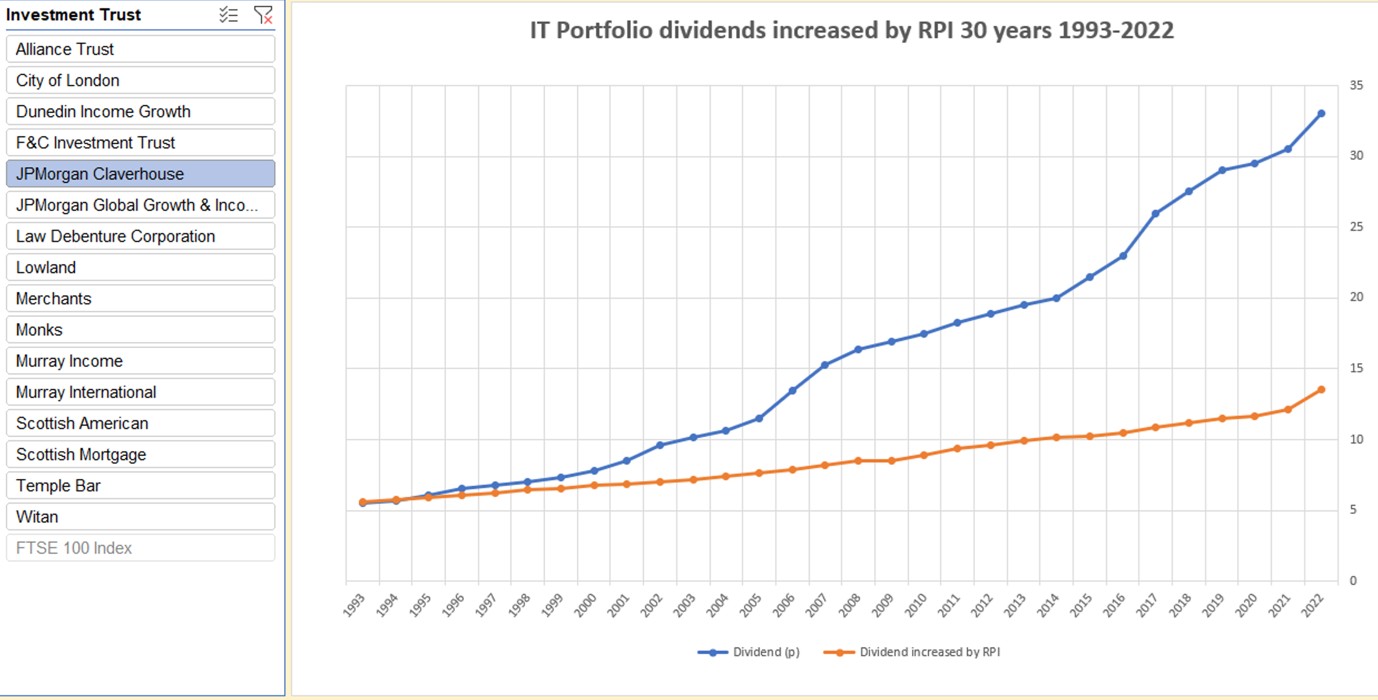
Claverhouse dividend increases beat inflation throughout the entire 30 years. Yes, 2022 had inflation at 11.6%, however that caused a problem for an investor only starting in the latter few years – what you are looking at here is the difference that comes from removing the term ‘guaranteed’ from inflation protection. After all, I very much doubt that many readers of this newsletter spend much on tobacco yet that forms part of the ‘alcohol & tobacco’ increase, and e-bikes and frozen berries are now added.
If you want to chat through the data on inflation and how the trusts have performed, we’re happy to spend 20 minutes on a zoom call. It’s good to talk.