2023 FTSE v trusts

by Doug Brodie
In this blog:
/1. Periodic active v passive reconciliation
/2. The Vanguard question
This is the investment of £1m into a portfolio of 8 trusts.
The orange bars show the income each year, the yellow line is cumulative income and the green area is capital over that time.

This is the annual growth rate of the income, measured over different time periods, and shown in discrete years plus compounded rates – you want the discrete figures, because that’s what you’ll feel in your pocket.

The data above may be interesting, however, it cannot be evaluated with a reference point. The reference we use is RPI, and for the thirty years shown RPI was 3.31%.
/1. Periodic active v passive reconciliation
From Kseniia’s desk:
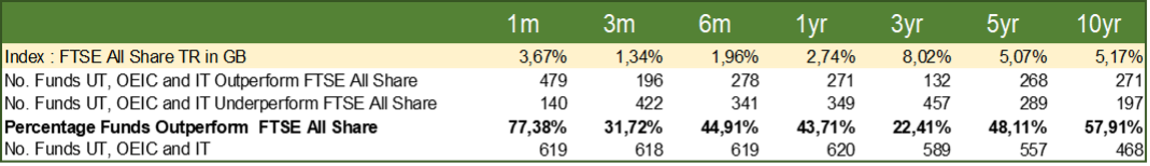
Below are two tables that show the number of UK Equity Funds that have outperformed or underperformed both the FTSE All Share in total return growth rate.
The first table shows cumulative returns for the period 1 month, 3 months, 6 months,1 year, 3 years, 5 years and 10 years.
The second table shows the total return annual growth discrete over a period of 10 years.

These UT, OEIC and IT funds have been selected across the following sectors:
IT Europe
IT Flexible Investment
IT Global
IT Global Equity Income
IT Global Smaller Companies
IT UK All Companies
IT UK Equity & Bond Income
IT UK Equity Income
IT UK Smaller Companies
UT Global
UT Global Equity Income
UT Mixed Investment 40-85% Shares
UT UK All Companies
UT UK Equity Income
UT UK Smaller Companies.
With additional selections such as: with a capitalization of more than £30 million; with asset weighting of more than 80% of shares; currency pounds sterling; on the market for at least a year.
Then we can identify the performance of the All Share and the number of funds that out- and under-perform the index over each period.
Next, we selected exclusively investment trusts with the same criteria.
In the result, we saw that over 10 years the total return growth rate exceeded the index by 2.09%, in matching these we analyze UT, OEIC and IT funds together.

Our analysis showed that 49 funds UT, OEIC and IT outperformed the FTSE All Share for all periods 1, 3, 5 and 10 years. In the data, we can see that most funds struggled to beat the index in 2020, the pandemic year. This is simply because the human managers had to wait for the economic and pandemic data to be published, and then tread carefully, working out what was likely to happen – any rational person would hold on and wait for clarity, as clearly happened.
However, in all cases the trusts outperformed the index in terms of income, both when measured as the volume of income and, more importantly, the volatility of income: no one wants an enforced pay cut in retirement.
/2. The Vanguard question
We use Vanguard and other index funds in the relevant portfolios, however not for income. The example we show below uses the UK’s oldest retail tracker which is from HSBC (Vanguard is a virtual newbie in the UK).
And the winner is…
In 2023 if you invested £100,000 in January as part of your income strategy, to date you’d have received a total income of £1,897. If you’d invested in Law Debenture trust you would have £4,053, and if it was Merchants’ trust you’d have received £5,045.

The HSBC fund declares its two distributions in May and in November, however, it does not pay that last dividend until January. We don’t happen to use Law Debenture as an income mainstay but it is still a competent performer if we take a relevant 10-year view.

Where Law Debenture does bring home the bacon is in its capital returns: the chart below shows the share/unit price of the FTSE tracker measured against both trusts.

The data allows us to track trends and to see what the balance sheets look like. We have no opinions, however, we have data, and our portfolios are created from the figures that data displays. Historical returns are not wholly predictable, however with trust income the data indicates that our pool of 31 trusts has a 100% payment record, and 97% record of paying the same or higher dividend each year.
That’s exactly what it says on the tin.