Crystal Ball

by Doug Brodie
In this blog
Past performance is not a reliable indicator of future returns
Consider two investments side by side, one with a return of 4% and one with 8% - which one is the more profitable?
High or low relative to what?
What the data says.
/1. Past performance is not a reliable indicator of future returns
If you paste the above line into Mr Google (other search engines are available) the first three items that come up on my screen are from Russell Investments, Forbes and Yieldstreet (who I don’t know).
Russell says:
"Past performance is no guarantee of future results."
But, the phrase contains a second meaning, too: A potential investment opportunities label: Don't discount an investment simply because it's done poorly recently -- it could improve.
Forbes says:
“SEC Rule 156 requires mutual funds to tell investors not to base their expectations of future results on past performance before they invest.”
Yieldstreet says:
“It has been established that past performance is not indicative of future results.”
Forbes is a cop out, simply repeating what the SEC prints - and Yieldstreet turns out to be selling collective property investment so has a natural bent against all asset classes except its own.
Russell invests around $290 billion for people and institutions. Interestingly it throws up the far side of the coin and gives us the message that performance is both up and down.
The point of the warning disclaimer is to prevent investment firms from suggesting to retail investors that they’ll get the positive returns when they too invest, and that is no doubt a required caveat. However what’s always missing from return calculations and commentaries is timescale, arguably the more important factor in investing.
/2. Consider two investments side by side, one with a return of 4% and one with 8% - which one is the more profitable?
The answer can’t be drawn from the information given, what’s missing is the timescale. If the 4% return is over a 6-month period and is then compounded after 12 months the value is up 8.16%. If the 8% return is over one year then it’s not as profitable as the 4% compounding sum. If you saw two investments that returned 147% and 173% would you know if they are good returns? If over a week, month or a year then yes, they were brilliant. If the period was over 11, 18 or 23 years would you know?
Remember this chart? It’s showing the same thing, the global stockmarket in 2020 but using different timescale to measure value. A is daily, B is monthly, and C is annually – take C, go to the beach, let the money look after itself. A is the way to an early grave and has absolutely no added value at all.

The issue is that we recognise twelve month returns, and we are taught to calculate returns on annual percentages. Without the annualised information we have no reference point, and without a scale that we know to measure a return against we can’t recognise if a return is high or low.
/3. High or low relative to what?
Yet again I came across comments in the FT generalising about the high cost and poor returns of UK investment managers: we are hired by you, our clients, in part for our research and that is anchored on net returns. If BT or Axa bonds were more profitable we would use them, if Scottish Mortgage was more suitable we’d use it, but the bottom line is that – just like houses, cars and wine, cheap is not necessarily better.
If you lived in a house half the value of your current home, the money saved growing at (say) 5% per year would make you a giant pot of money by the time you die.
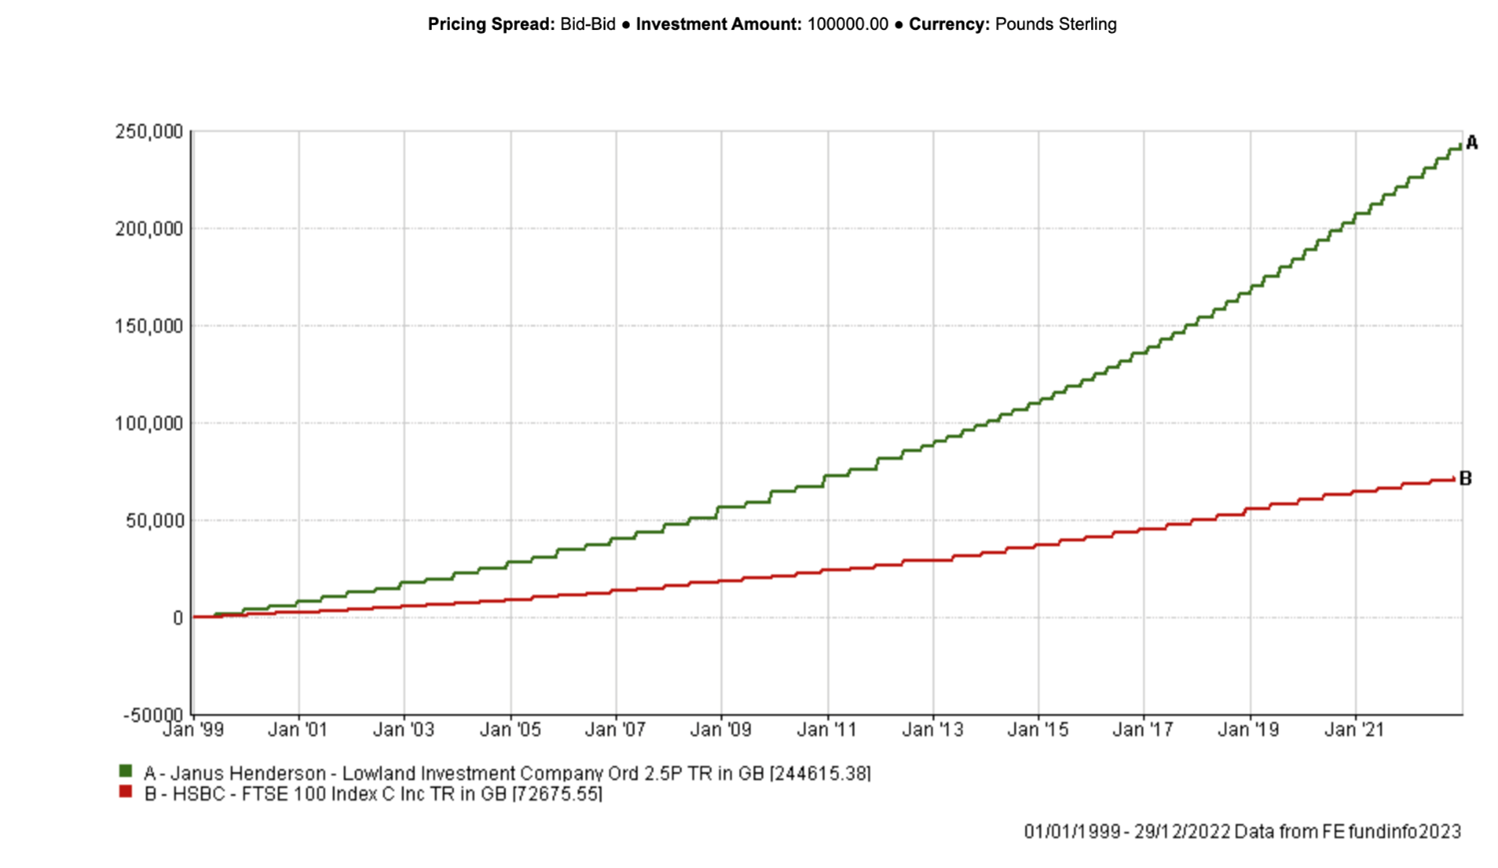
With £100k over 23 years to December 2022, the HSBC FTSE100 tracker fund paid out £72,675 in income, whereas Lowland paid £244,615. The HSBC fund charge is 0.11% per year, Lowland is 0.57%.
Cost is what you pay, value is what you get.
/4. What the data says
Don’t buy Lowland.
We took most client money out two years ago because of the data - we didn’t like what the figures were telling us. Everything we do for our clients involves numbers, so we build workbooks and spreadsheets of numbers all looking for the same things: patterns.
An investment trust is a company and it’s because of that structure they are able to defeat trackers, ETFs and even direct shares in the monotonous reliability of their annual income – which is good for you. The items in their balance sheets allow us to track how they move from year to year; because they are companies they have to publish to Companies House, every year, their report and accounts, and that’s what we analyse.
With their balance sheets its fairly straightforward for us to establish whether or not a dividend will be paid, that is not the risk for us. What we are more concerned about is the ebb and flow of assets in the reserves and working out the probability of a continued increase in the coming year, and others down the line. We will quite happily project client income month-by-month over the next ten years, and to do that we need to be happy and secure in the engine delivering that income.

There was something we were uncomfortable with Lowland’s figures and being independent we felt a more predictable source of income could be found elsewhere. With income investing it’s always correct to take the higher level of predictability when selecting an asset.