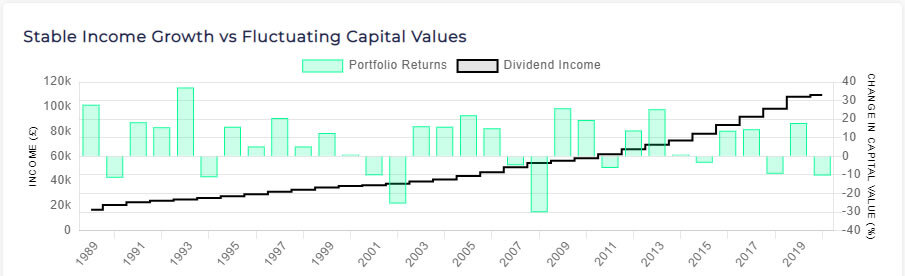
When the sun rises on the first day of your retirement,
what you need is a reliable monthly income.
Get our rather marvellous Saturday morning email
A weekly email and exclusive content for people just like you
(and absolutely no boring stuff)
By submitting this form you consent to our Privacy Policy. (We’re a decent lot and promise to treat your details with respect.)
Free Income Planning Calculators


As featured in:

Planning with confidence

Are you ready?
Get your personal
score and report, now.

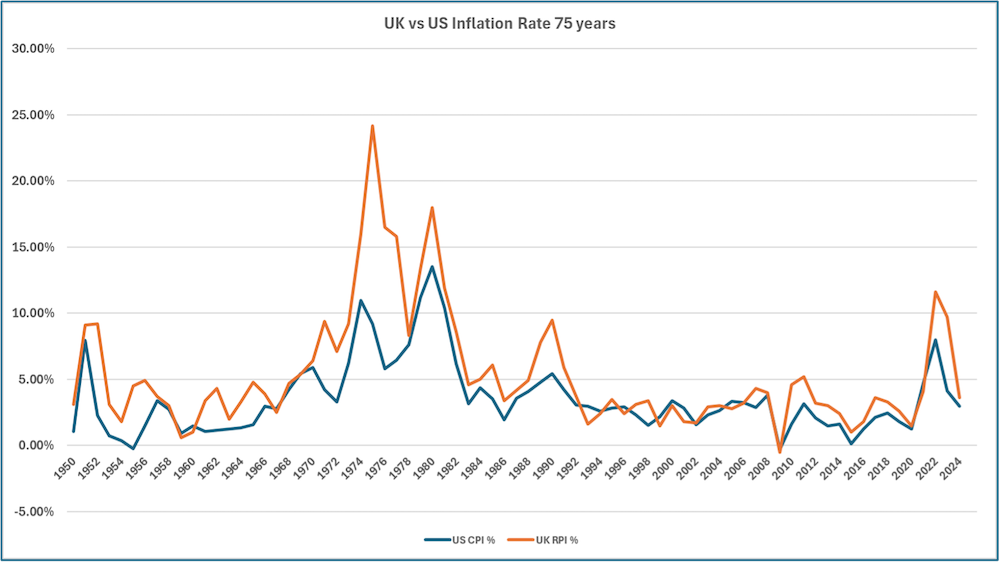
Beating inflation
Read more, or go straight to try
our RPI-analysis tools

Meet the team
The people behind Chancery Lane,
our expertise, our history.
We’re people like you
Bridget McIntyre
William Todd
Kim Lerche-Thomsen
Ian Manning
Only Chancery Lane specialises in just one thing — investing for income for baby boomers.

Bucket List Top 50
How many have you ticked off?

Wellbeing
Dealing with a new life without a daily schedule.

My Generation
What it means to be a boomer — how many of these experiences defined your life?