Death and Taxes. Cost and Value

by Doug Brodie
In this blog:
Death and Taxes: financial planning can help with both of them
The difference between cost and value: only concern yourself with the areas that make a difference.
Death and Taxes: financial planning can help with both of them

Life expectancy in the UK has fallen, however that is due to the pandemic. The good news is that for those who have reached 65, men still have 19.7 years expectancy and women have 22 years. (ONS) Money makes you healthier: people in the south of England live for longer and in better health than people in the north (https://ageing-better.org.uk/health-state-ageing-2022), so getting your income in retirement correct means you are likely to be less stressed and more healthy. The table above is within our planning tools and shows two variants of a client plan being compared: you can see the annual tax is 50% higher in the plan on the left than the one on the right.
However the table below shows the cumulative total of tax paid over the client’s lifetimes is actually lower with the drawdown plan on the right than with the base plan - £166,000 in tax saving.

Planning clearly helps save tax. Cutting anxiety helps your health and the personal value of your retirement by introducing certainty to your expectations. Given that markets are not precise, we can interrogate the system to calculate the rate of investment return needed to prevent any shortfall in income, for life. More, given you and I know that we have not seen the last of the world’s great market crashes, we can model income and assets with a market crash built into it, e.g. we can calculate what happens if there is (say) a 40% fall three years after you have started living on your investment income. It won’t stop it happening, but it will enable you to know not to worry – we cannot be in control of external events, but we are in control of how we react to them.
This is the index of some of modelling scenarios we run for clients:

Note: it’s only with accurate modelling that we can project IHT issues at the end of our lives, so if it’s an issue for you (or your kids) you should probably have the numbers crunched. As time changes, so do taxes and market returns, so when taxes like the LTA disappear we can see straightaway what changes it makes to your financial life …. or the future income of the kids and grandkids.
The difference between cost and value: only concern yourself with the areas that make a difference
On costs: the average monthly return of the FTSE 100 index over the last twenty years is 0.45%; that turned £100,000 into £203,370, however with its dividends added back in the value came to £425,580.
The cost is a % rate, and because the value fluctuates constantly you will only know the net cost you paid at the END of your investment period, not the beginning. Now you’ve got a problem because you’d need to know how often the charge is applied, and what the value was when it was applied. The reason I point this out is because there are reams of media comment from ‘experts’ who tell you to ensure you have the lowest possible cost when investing. But as you can see, the cost at the start does not tell you what you are going to pay in charges, so when you read that over (say) thirteen years in a pension the difference between an iShares passive tracker at 0.07% and an active managed fund at 0.45% means that on £100k you are guaranteed a loss of (0.38% x £100k x 13) = £4,940, that is boloney. That is the difference in flat fee, it is not the difference in return.
I chose 13 years because that is how long the iShares FTSE ETF has been running. The closest all-UK trust I could find is Mercantile, managed by JP Morgan at 0.45% per year; not a trust we use as it doesn’t fit our income criteria, however for the annual difference of 0.38% in their fees they delivered an extra 108% return, an extra £108,420 over the thirteen years. The FTSE100 index including divs returned 6.83% annually, the iShares passive tracker 6.63% annually and Mercantile returned 9.87%.
When you see an advert or editorial stating active managers are a rip off, active can’t beat passive and cost is all, then you are the product. Don’t sacrifice your retirement for cheap.

As an addendum
Look at those annual returns: in our software the overall growth assumption we use is 7% gross (6% net of our annual fee). Our core portfolio over the term above ran at 8.77% so we are building a safety margin of 25% in annual returns into our modelling. We think that’s the right way to run your retirement income projections because as much as we seek to cover all bases, ‘there may be trouble ahead’.
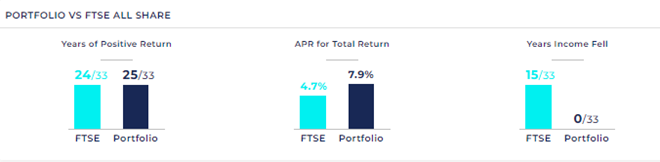
Go on to our income dashboard here: https://db-chancerylane.net/ Scroll down to the bottom and you’ll see the real difference for you as an income investor when choosing between cheap passive and paid-for active, though time using our portfolios. The bottom widgets are key – you never want your income to fall in retirement and the tool measures over the last thirty five years.